Definition and Usage: What is Electronic SpreadSheet? What is it used for?
An electronic spreadsheet is a type of computer application program that is used to calculate, analyze, organize, and store data in tabular form. Electronic spreadsheets, such as Microsoft Excel, Google Sheets, and Apple Numbers, are powerful tools for data computation.
It can also be defined as an application software used to analyze data, manipulate data, and store data. Spreadsheets are frequently used in accounting, business, data management, data analysis, etc.
Usage
Electronic spreadsheets not only enable users to compute, examine, and produce information but also help in the visualization of information. Electronic spreadsheets are primarily used to automate and streamline operations involving numerical data, data management, financial analysis, and budgeting.
In education, electronic spreadsheets help in tracking student grades, managing class schedules, and other data analyses for projects. It is indeed a valuable tool to use for both teachers and students.
Due to the adaptability and effectiveness of electronic spreadsheets in handling complex computations and data manipulation, these applications are widely used in various industries, such as finance, accounting, marketing, project management, and much more. Additionally, electronic spreadsheets provide users with the ability to create insightful charts and make well-informed decisions through the use of functions, formulae, and other capabilities.
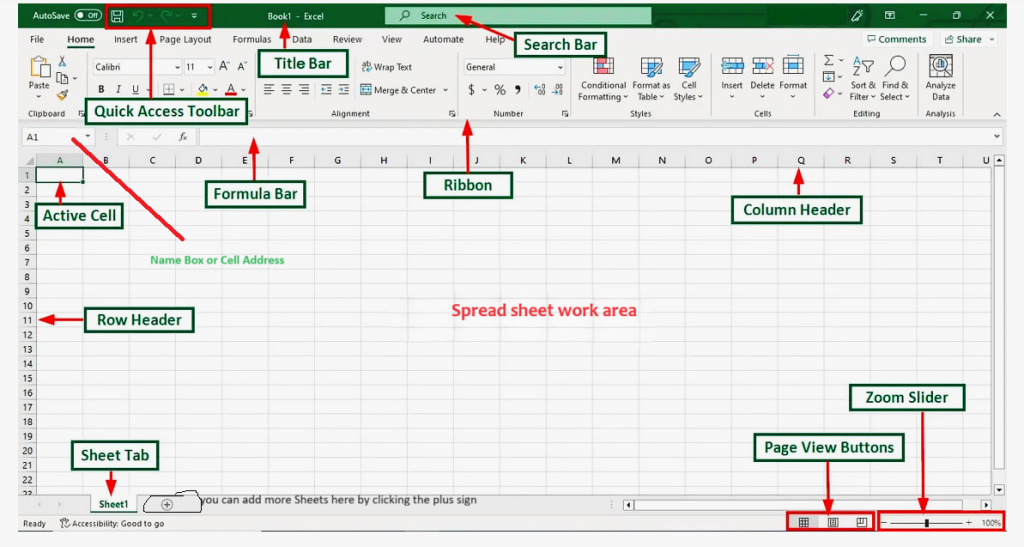
Basic Features, Components and Functions
i. Data Entry and Storage
- Worksheets: This is a single page within a spreadsheet file that allows users to manage and separate different datasets. A worksheet consists of cells in which you can enter and calculate data sets.
- Workbook: A workbook is an entire file containing multiple worksheets that helps you to organize data.
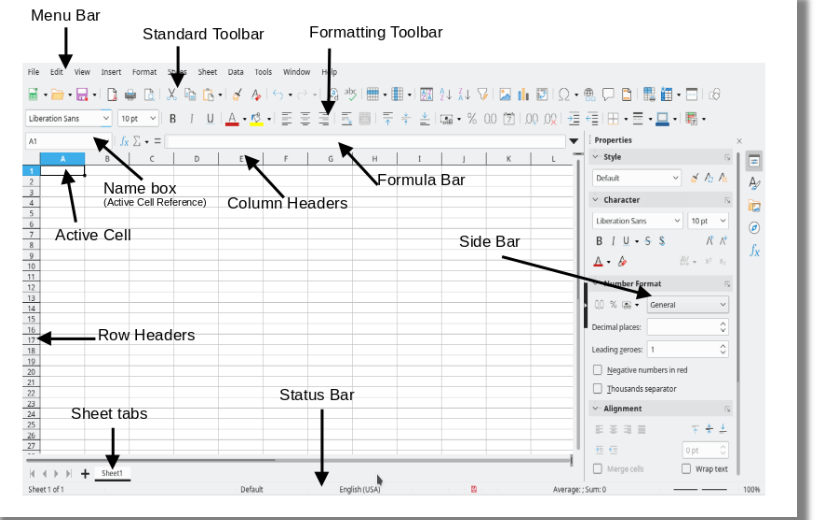
- Rows and Columns: Cells are organized into rows and columns, that helps structure and categorize data. Rows are identified by numbers and run horizontally, while columns run vertically and are labeled with letters.
- Cells: This is the intersection of a row and a column, that can be referenced by its address (e.g., A1, B2, B1, B2). Data is entered directly into the cell that are organized in a grid of rows and columns, it makes large datasets easy to manage.
ii. Data Formatting
- Formatting Cells: You can customize the appearance of cells under these tools (font type, color, size, background color, etc.).
- Formatting Numbers: This is to format numbers as percentages, currency, time, dates, or other custom formats.
- Conditional Formatting: This will automatically format cells based on their values (e.g., highlight cells greater than, less than or any specific value).
iii. Formulas and Functions
- Basic Arithmetic: Operations like addition, subtraction, multiplication, and division.
- Built-in Functions: These are predefined formulae for simple and complex calculations. e.g., SUM, SUMIF, MIN, MAX AVERAGE, COUNTIF, etc.).
- Logical Functions: These are the functions that perform logical operations such as; IF, AND, OR, NOT.
- Text Functions: Manipulate text strings (e.g., CONCATENATE, LEFT, RIGHT, MID, TRIM).
- Date and Time Functions: Date and time values are managed under these functions (e.g., TODAY, NOW, DATE, TIME, MONTH, YEAR).
iv. Data Analysis Tool
- Data Validation: This is to restrict a type of data that can be entered into a cell.
- Filter and Sort: To allow you to organize and filter data to display only the information that you need.
- What-If Analysis: Using tools such as Scenario Manager, Goal Seek, and Data Tables to forecast outcomes based on several variables.
v. Data Visualization
- Charts and Graphs: These tools allow users to create visual representations of data, such as bar charts, pie charts, line graphs, etc.
- Pivot Tables: This will summarize and analyze large datasets by organizing data into a more manageable format.
- Sparklines: Miniature charts within a single cell to show trends in a series of values.
vi. Macros and Automation
- Macros: This Record and automates tasks that are repetitive using a sequence of actions.
- Scripting: Use scripting languages like VBA in Excel and Google Apps Script in Google Sheets to create custom functions and automate complex workflows.
vii. Collaboration Features
- Sharing and Permissions: Enables the user to Share spreadsheets with others and control their access levels (to view, comment, edit).
- Collaboration in Real-Time: It gives multiple users the ability to work on the same spreadsheet simultaneously and view each other’s changes in real time.
- Comments and Notes: This adds comments and notes to provide context or instructions for specific cells or ranges.
viii. Import/Export and Integration
- Data Import: This feature helps in Importing data from various sources, such as CSV files, databases, or online sources.
- Data Export: This exports data to different formats for use in other applications or for the purpose of sharing.
- Integration: This tool Connects spreadsheets with other software and services like CRM systems, APIs and cloud storage, in order to streamline workflows.
ix. Protection and Security
- Backup and Recovery: Automatic saving and version history to prevent data loss and recover previous versions.
- Password Protection: Secure entire spreadsheets or specific sheets with passwords.
- Cell Protection: Lock specific cells or ranges to prevent unauthorized alteration.
Types of Electronic Spreadsheets
Electronic spreadsheets programmes have made data administration, analysis, and presentation easier for both individuals and enterprises, making them essential tools. Microsoft Excel is still the most well-known brand in the spreadsheet industry. There are other kinds of electronic spreadsheets though, each with special benefits and capabilities. Let’s examine a few spreadsheets and what distinguishes them.
i. Microsoft Excel
Microsoft Excel is a spreadsheet programme developed by Microsoft company. It is arguably the most popular spreadsheet application in use today. MS Excel is loved by both professional and non-professional users because of its robust features and versatility.
Features:
- Excel’s extensive function library includes everything from simple arithmetic to intricate statistical calculations.
- Pivot tables and charts: These are effective tools for visualizing and summarizing data.
- Macros and VBA: They use Excel’s built-in programming language, Visual Basic for Applications, to automate repetitive processes.
- Add-ins: A range of add-ins from third parties can expand capabilities.
- Real-time collaboration tools are available in Excel 365 and Excel Online.
MS Excel is excellent for managing projects, manipulating huge data sets, conducting in-depth financial analyses, and many other tasks.
Excel is very popular among professionals in a variety of industries due to its dependability and extensive feature set. Because of its broadness and familiarity, users can accomplish nearly whatever they need to.
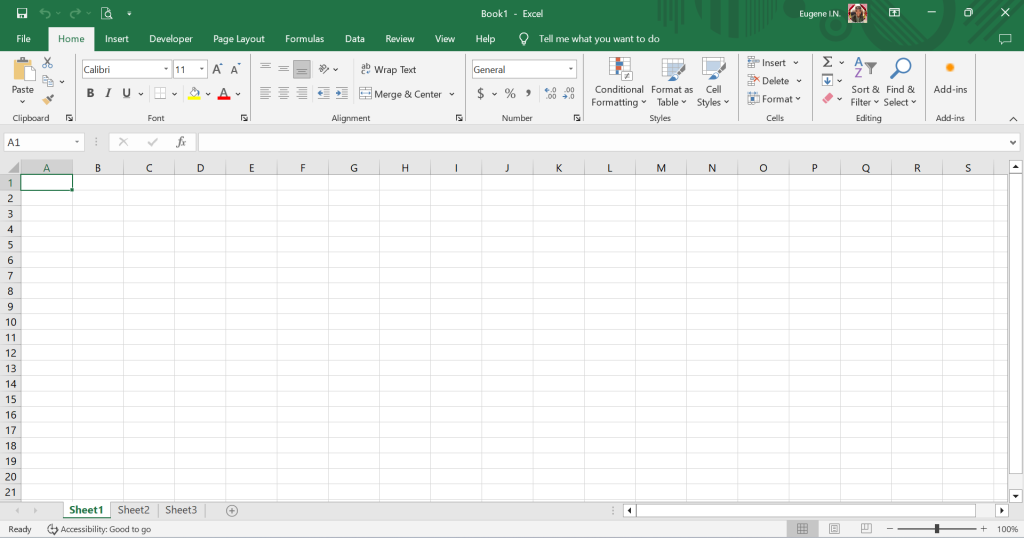
Snapshot of empty ms excel window (image above)
ii. Google Sheets
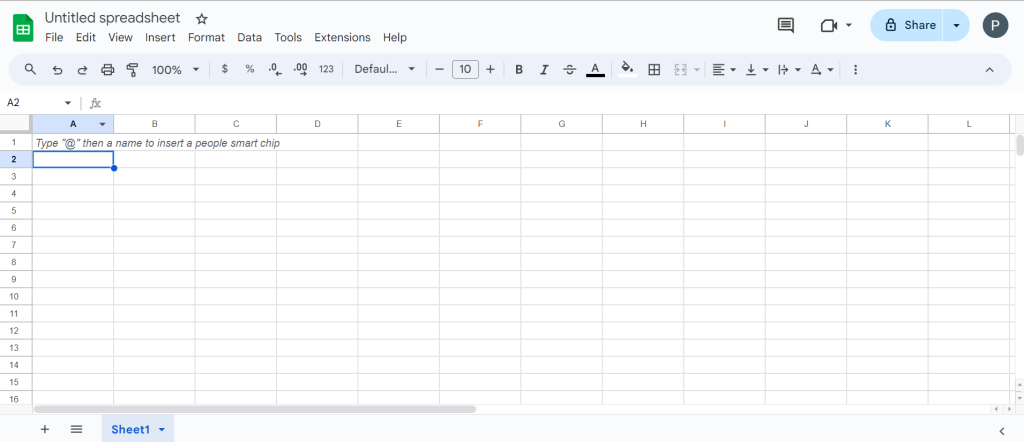
Google Sheets is a cloud-based spreadsheet software that leads in accessibility and collaboration because of its smooth integration with other Google Workspace applications,
Features:
- Accessibility: You can use any internet-connected device to access your spreadsheets.
- Real-Time Collaboration: Multiple users can collaborate in real time while working on the same document.
- Version History: Easily keep track of modifications and roll back to earlier iterations as needed.
- Add-ons: Expand the functionality of your Google Workspace Marketplace experience with a variety of add-ons.
- Integration: Establish a connection with Google Data Studio, Forms, and additional Google services.
Ideal for team projects, educational purposes, and situations where real-time collaboration is essential. It is a popular option for both individuals and teams due to its smooth connection with other Google services, ease of use, and real-time collaboration capabilities. With Google Sheets, working on collaborative projects is simple and easy.
iii. Apple Numbers
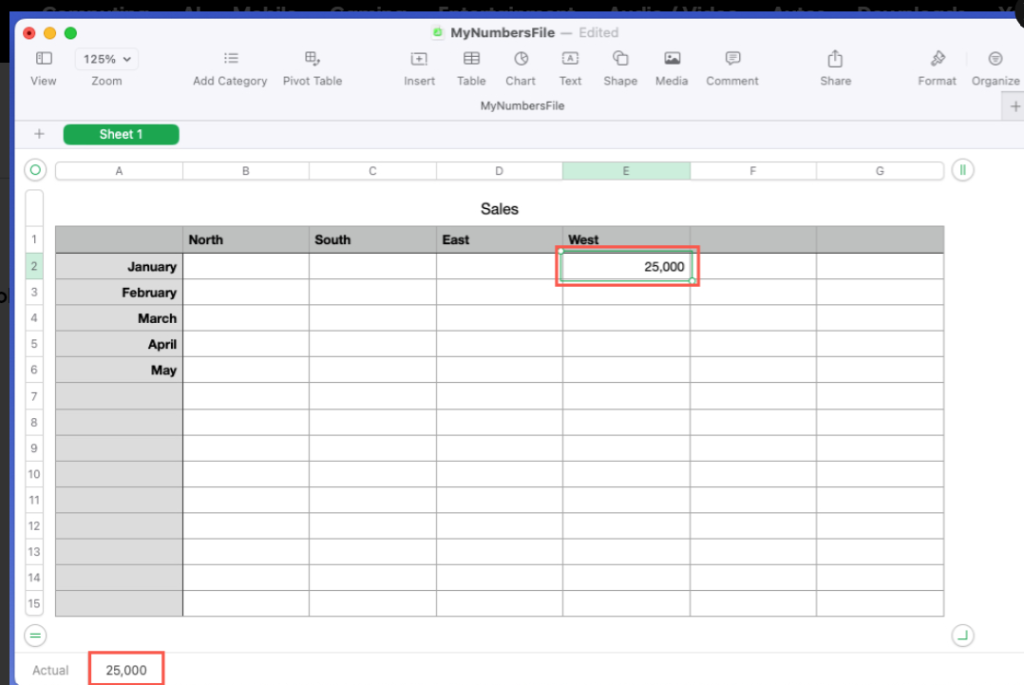
As part of the iWork suite, Apple Numbers (Numbers) is a spreadsheet program that was created by Apple Inc. and has an intuitive and visually appealing interface for users of Mac and iOS.
Features:
- Collaboration: Work together with other iWork users in real time.
- iCloud Integration: Keep all of your Apple devices’ spreadsheets up to date.
- Usability: Creating spreadsheets is simple even for inexperienced users because to intuitive design.
- Templates: To help you get started right away, there are lovely templates for budgets, bills, and more.
- Interactive Charts: To visualize your data, create dynamic, interactive charts.
Perfect for personal use, small businesses, and creative professionals who value design and aesthetics. For fans of iOS and Mac, its clear, easy-to-use interface and smooth connection with Apple products make it a pleasure to use. Apple Numbers effortlessly transforms data into eye-catching displays.
iv. LibreOffice Calc
One part of the LibreOffice software suite is LibreOffice Calc. It is an open-source spreadsheet program that is available for free as part of the LibreOffice package.
Features:
- In terms of cost, it is entirely free to use; therefore, anybody can use it.
- Community Support: Its continued development is aided by a robust user and development community.
- Compatibility: Multiple file formats, including Microsoft Excel, can be opened and saved.
- Customization: A wide range of extensions and templates allow for extensive customization.
- Functionality: With a vast array of features and functionalities, it functions similarly to Excel.
Suitable for individuals, small enterprises, and non-profits seeking a free substitute for spreadsheet software that costs money.
It’s a fantastic option for anyone who would rather not spend money on commercial software because of its low cost, robust functionality, and vibrant open-source community. Everyone can manage their data with LibreOffice Calc, regardless of their financial situation.
Summary
There are many types of electronic spreadsheets, each designed to meet specific requirements and tastes. There is a spreadsheet program out there for everyone, be it an individual looking for an intuitive interface, a team searching for seamless communication, or a business expert in need of strong analytical tools.
By choosing the appropriate tool for your unique needs, you may increase the effectiveness and efficiency of your data management and analysis jobs by being aware of the advantages and disadvantages of each type.
The effectiveness with which you can work with your data can be greatly enhanced by selecting the appropriate spreadsheet software. You may fully utilize the robust features that electronic spreadsheets provide by investigating these choices to find the one that best suits your requirements. More resource materials (academic) can be found on this link: (PDF) INTRODUCTION TO MICROSOFT EXCEL (researchgate.net)


